School of Psychology - Georgia Institute of Technology
(as of July, 2009)
View the license and download the Sonification Sandbox
 The Sonification Sandbox
is a project of the Psychology Department's
Sonification Lab at the Georgia
Institute of Technology, overseen by Bruce Walker, PhD. Motivated by a need
for a simple, multi-platform, multi-purpose toolkit for sonifying data,
the Sonification Sandbox allows the user to map data to multiple auditory
parameters and add context using a graphical interface.
The Sonification Sandbox
is a project of the Psychology Department's
Sonification Lab at the Georgia
Institute of Technology, overseen by Bruce Walker, PhD. Motivated by a need
for a simple, multi-platform, multi-purpose toolkit for sonifying data,
the Sonification Sandbox allows the user to map data to multiple auditory
parameters and add context using a graphical interface.
Data can be imported from CSV files (which can be created in MS Excel, for example), and manipulated/edited in a spreadsheet. The mapping between the data and the visual and auditory graphs can be changed in many ways. Visual and auditory renderings of the data are available, and the visual and auditory graphs can be exported as images, data files, audio files, and even multimodal QuickTime movie files, in a range of file formats.
In fact, the most recent versions of the Sonification Sandbox (versions 5 and later) really represent a flexible sonification platform that can be modified, extended, and driven by data in a very flexible manner.
The Sonification Sandbox is written in Java, using the JavaSound package to create MIDI output. Any computer with Java (2.0 or greater) installed and a General Midi enabled sound card can run the application.
Sample Screenshots (may vary with new releases):
(note: click on the thumbnails to view a larger creen shot in a new window)
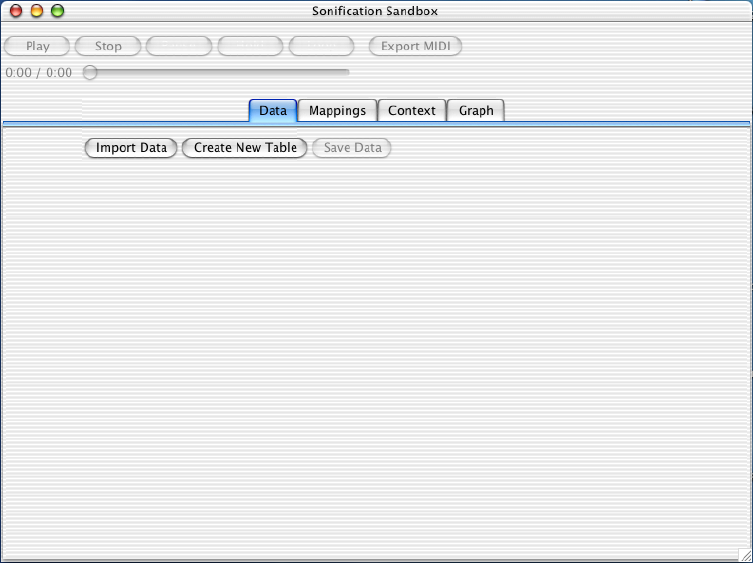 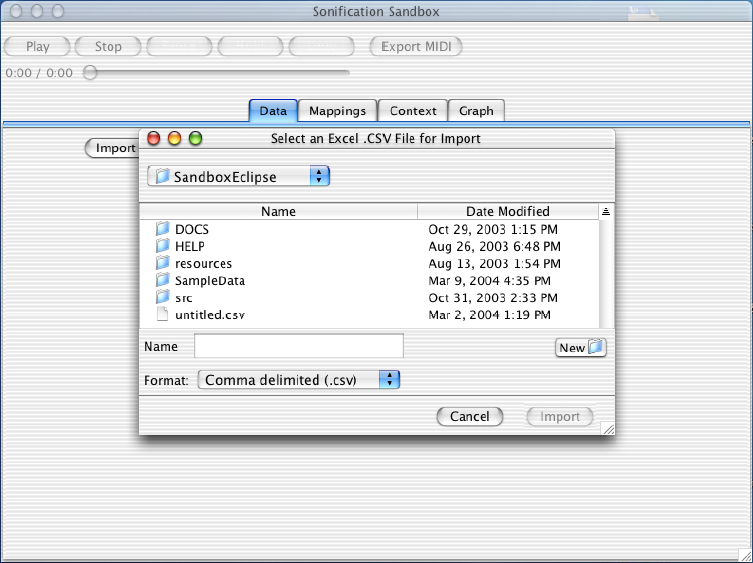 |
The Sonification Sandbox when it is first opened. Before the application can create a sonification, data must be imported or added to a table the user creates within the Sandbox Data panel. When the user imports data it will automatically be loaded into the table. For importing, the data must be in the following format: 1) an Excel .CSV file, 2) an MxN matrix, and 3) numerical data (with or without column names as the first row in the file). |
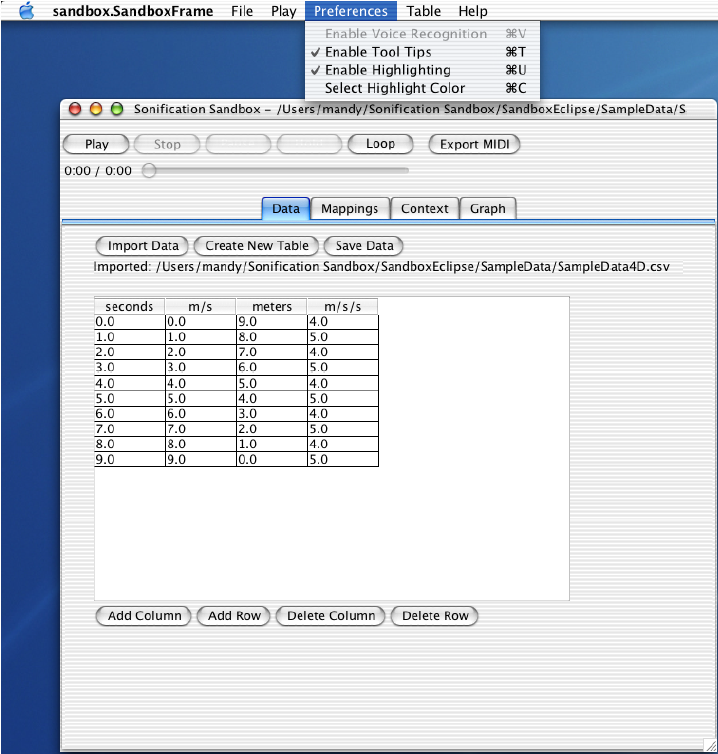 |
Users can create a table by specifying the number of columns and rows. The table allows simple manipulation of data, including editing numerical data, adding/removing columns and rows, and changing column names. All changes are automatically reflected in the other tabs. For more sophisticated data manipulation the user will need to use an outside spreadsheet, such as Microsoft Excel. |
 |
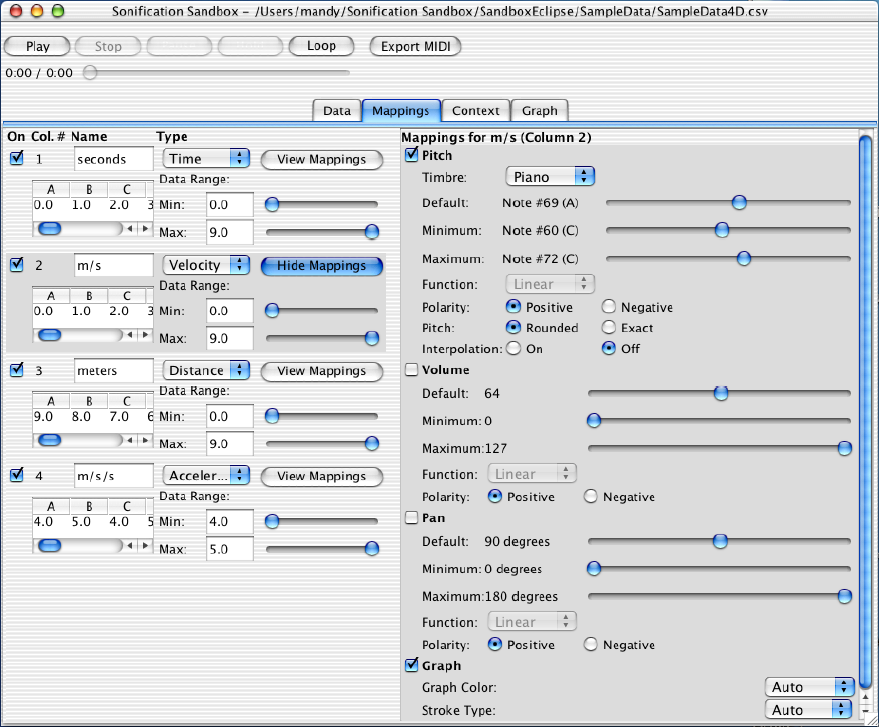
Once data is visible in the table, the Mappings tab is loaded with the default mappings. One and only one of the data sets can be mapped to Time; the other data sets will be mapped against the Time axis (Note: the axis chosen for Time must be uniformly increasing, otherwise the data will not be sonified properly). You can turn a data set's sonification on or off by selecting or deselecting its check box. |
|
A sonification can be played using the default mappings, however, the most interesting results are achieved by adjusting the mappings for each data set. The length of the sonification can be expanded or compressed (by default it is 10 seconds long). Other data sets can be set to differing timbres, pitch ranges, volumes, and pan levels; a large number of variations can be achieved in this manner. |
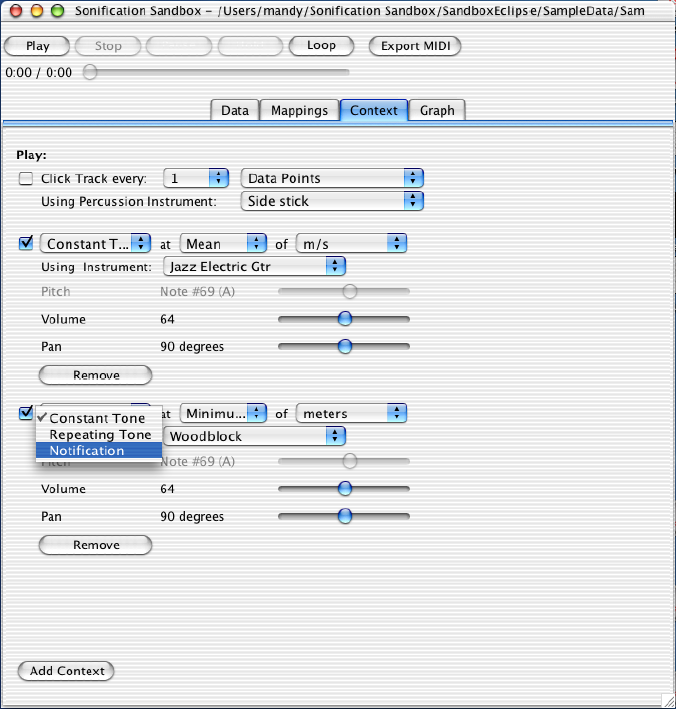 |
In the Context tab, additional sounds can be added, analogous to the x-axis, y-axis, tick marks, trend lines, etc., of visual graphs. The Click Track (marking time, like an x-axis) can be turned on or off, and the instrument can be changed. The user can add or remove other context sounds for constant or repeating tones, and notifications, and set the parameters of each. |
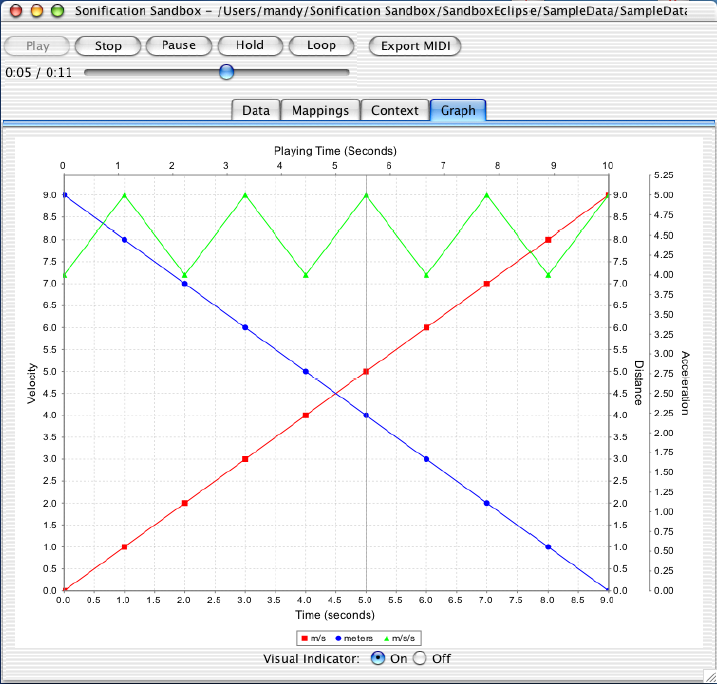 |
The Graph tab allows the user to view the current data in a visual graph. Each y-axis represents the range for all the data sets using that Type (set in Mappings). When you are listening to the sonification and the Graph tab is visible, a visual indicator is available to show what data point(s) the sonification is playing at the time. |
Download:
View the license and download the Sonification Sandbox
Contact: