School of Psychology - Georgia Institute of Technology
Background
Peripheral auditory displays combine the best qualities of sonification and the specific needs of peripheral monitoring, in an effective, but also aesthetically pleasing and acceptable form. We use natural sounds such as birdcalls, insect songs, rain, and thunder to create an immersive soundscape to sonify continuous data such as the stock market index. This approach leads to a display that can be easily distinguished from the background when necessary, but can also be allowed to fade out of attention, and not be tiring or "intrusive" when not desired.
Soundscapes System To develop and study these soundscape displays we have created an authoring environment that can take in a stream of data, and based on a mappings table build the dynamic sound environment. We have tested it with stock market data, and presented the results at ICAD and HFES in 2004. To get a feel for the way these interfaces are constructed, you should download this sample file (MP3 format, 8 MB!), and listen to it once before reading any farther. Note that it is over seven minutes long. Then, come back and read more about the levels and thresholds, before listening to it again.
Architecture
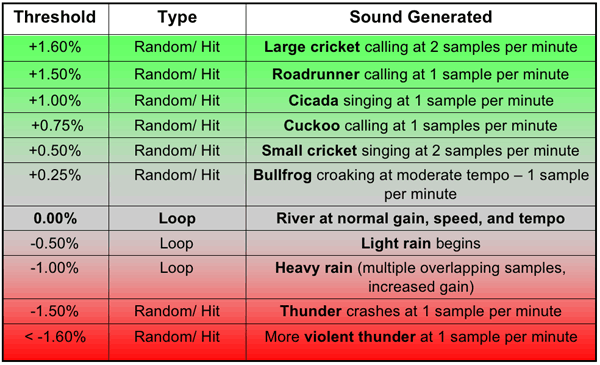
The system is written in Java, building on the JASS audio synthesis system. Changes in the data are represented by adding sounds to the ecological backdrop. For example, if the soundscape is a forest theme, there may be a backdrop of a river. As the data value increases (e.g., the stock market index goes up), bird calls, crickets, frogs, and other forest sounds are added, one by one (see the sample chart, below). The sounds are high quality clips, and sound engineered to blend and fit together. Further, there are clever randomizations in the system, so it is always dynamic and fresh. As the data rises further, additional animal calls are heard. If the data goes negative, the animals slowly are removed, one by one, and the sound of thunder, then rain are added to signify the negative data values.

More Information
The Java code is available for those who may wish to explore this type of peripheral interface. If you are interested, please contact us.
You may also find the following papers of interest. They discuss different aspects of this project:
Mauney, B. S., & Walker, B. N. (2004). Creating functional and livable soundscapes for peripheral monitoring of dynamic data. Proceedings of the Tenth International Conference on Auditory Display ICAD2004, Sydney (6-10 July).
Mauney, B. S., & Walker, B. N. (2004). Designing systems for the creation and evaluation of dynamic peripheral soundscapes: A usability study. Proceedings of the Annual Meeting of the Human Factors and Ergonomics Society (HFES2004). New Orleans, LA (20-24 September) pp 764-768.
And, again, the sample file (MP3 format).
Contact: