In November, 2000, the US Presidential Election voting in Florida became a bigger part of this nation's history than many would have anticipated.
Most of the discussion and press coverage surrounded the votes for George W. Bush and Al Gore. However, one of the equally important electoral controversies circled around perceived irregularities in the counting of the votes for Pat Buchannan in a particular precinct.
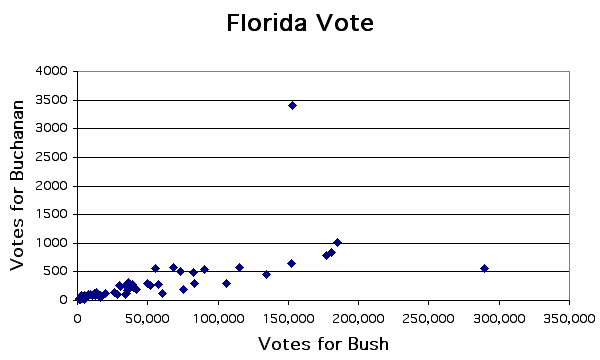
The data comparing Bush and Buchannan votes in each Florida riding was used to demonstrate how scientific data can be displayed visually (see the graph, below), or auditorily (click on either of the links, below).
Question: Do there seem to be oddities in the data here? Is it likely that such a difference could simply be the result of Buchannan popularity in one little region? Obviously, the data do not answer that question, but they do make for an interesting auditory display!
Figure 1. Votes for Bush and Buchannan in each Florida district.

Listen to this auditory graph: [.wav format] [AIFF format]
Bruce N. Walker and David Lane