School of Psychology - Georgia Institute of Technology
<< Sonification Sandbox Software Page
As you go through the tutorial, please be sure to click on the thumbnails to view larger screenshots in a new window.
 When
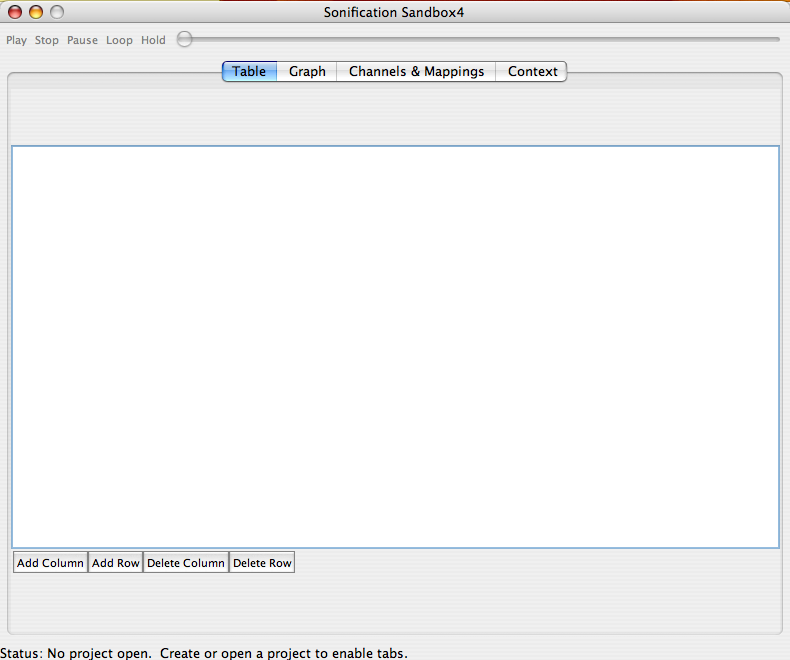
the Sonification Sandbox is first opened, the table is empty. To
begin, you may add data manually or import a CSV. If adding manually,
begin by going to File, then New Project.
When
the Sonification Sandbox is first opened, the table is empty. To
begin, you may add data manually or import a CSV. If adding manually,
begin by going to File, then New Project.
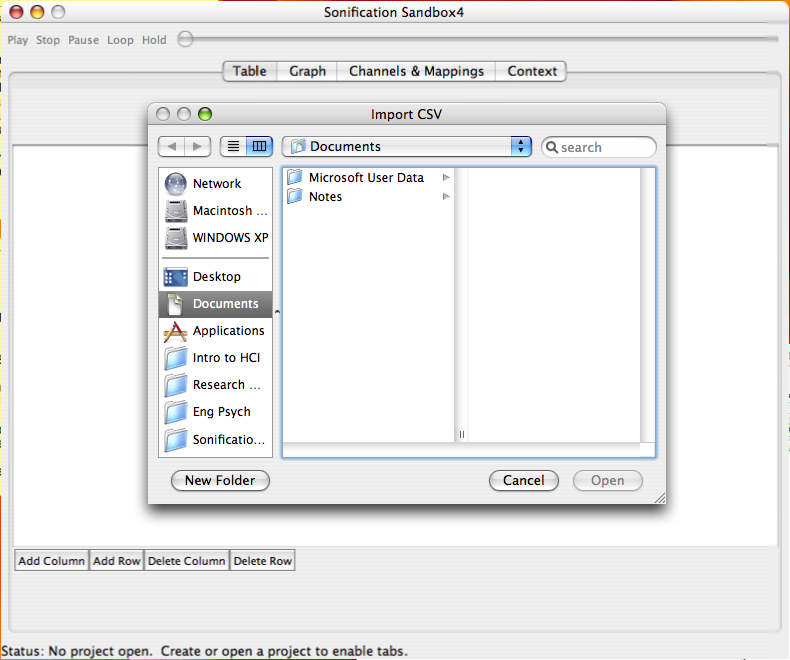 For more sophisticated data manipulation, the user can import outside
spreadsheet. When the user imports data it will automatically be loaded
into the table. For importing, the data must be in the following format:
1) an Excel .CSV file, 2) an MxN matrix, and 3) numerical data (with
or without column names as the first row in the file).
For more sophisticated data manipulation, the user can import outside
spreadsheet. When the user imports data it will automatically be loaded
into the table. For importing, the data must be in the following format:
1) an Excel .CSV file, 2) an MxN matrix, and 3) numerical data (with
or without column names as the first row in the file).
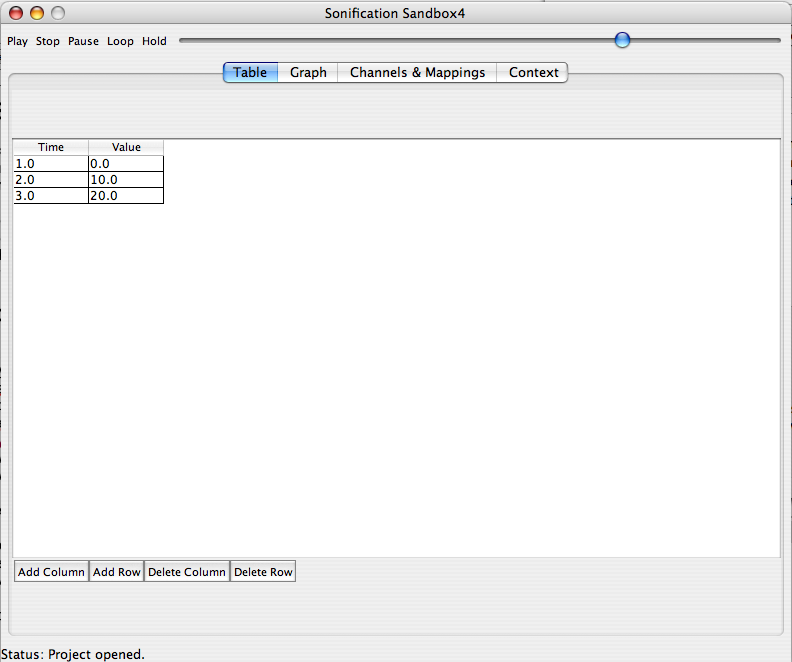 You
may add or delete columns and rows using the buttons at the bottom of
the page. The table allows simple manipulation of data, including editing
numerical data, adding/removing columns and rows, and changing column
names. All changes are automatically reflected in the other tabs.
You
may add or delete columns and rows using the buttons at the bottom of
the page. The table allows simple manipulation of data, including editing
numerical data, adding/removing columns and rows, and changing column
names. All changes are automatically reflected in the other tabs.
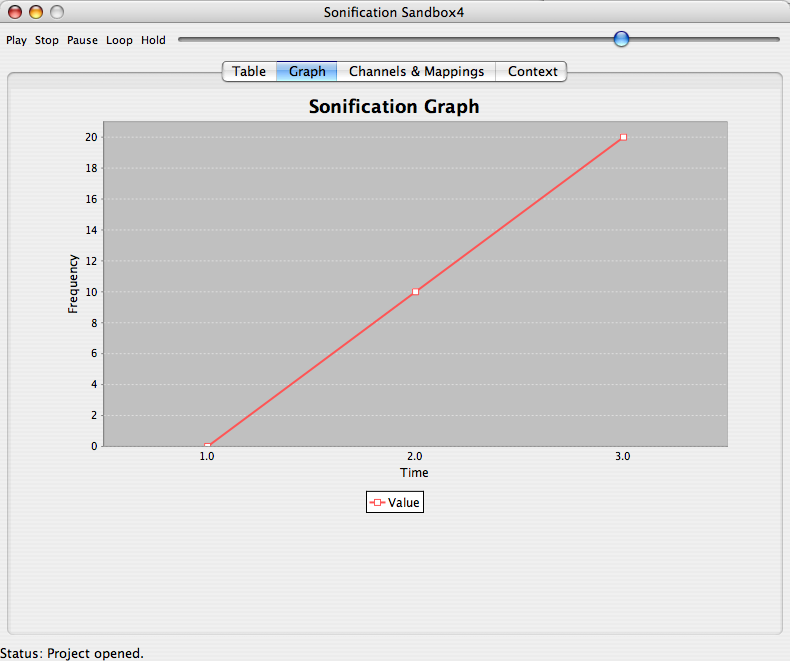 Once
data is visible in the table, the other tabs are loaded with the default
mappings. In this example, the graph of the original data table is shown.
To hear the sonification, the user may simply click the play button.
Once
data is visible in the table, the other tabs are loaded with the default
mappings. In this example, the graph of the original data table is shown.
To hear the sonification, the user may simply click the play button.
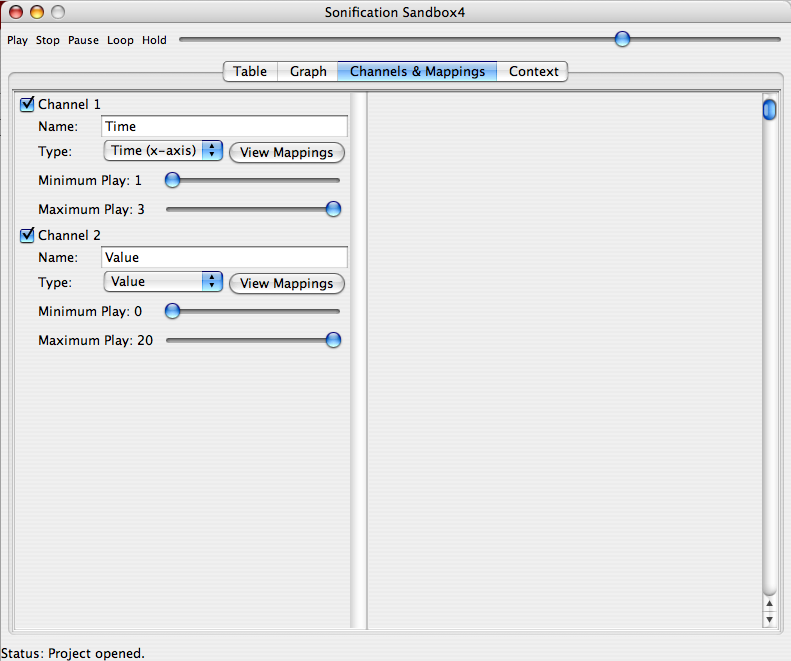 The Channels & Mappings tab is loaded with the default mappings. One
and only one of the data sets can be mapped to Time; the other data
sets will be mapped against the Time axis (Note: the axis chosen for
Time must be uniformly increasing, otherwise the data will not be sonified
properly). You can turn a data set's sonification on or off by selecting
or deselecting its check box.
The Channels & Mappings tab is loaded with the default mappings. One
and only one of the data sets can be mapped to Time; the other data
sets will be mapped against the Time axis (Note: the axis chosen for
Time must be uniformly increasing, otherwise the data will not be sonified
properly). You can turn a data set's sonification on or off by selecting
or deselecting its check box.
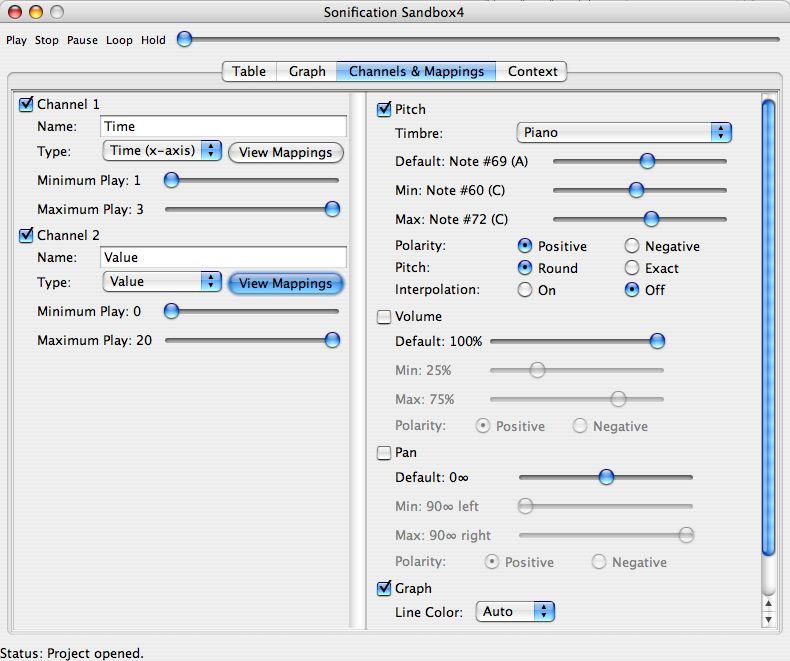 A
sonification can be played using the default mappings, however, the
most interesting results are achieved by adjusting the mappings for
each data set. The length of the sonification can be expanded or compressed
(by default it is 10 seconds long). Other data sets can be set to differing
timbres, pitch ranges, volumes, and pan levels; a large number of variations
can be achieved in this manner.
A
sonification can be played using the default mappings, however, the
most interesting results are achieved by adjusting the mappings for
each data set. The length of the sonification can be expanded or compressed
(by default it is 10 seconds long). Other data sets can be set to differing
timbres, pitch ranges, volumes, and pan levels; a large number of variations
can be achieved in this manner.
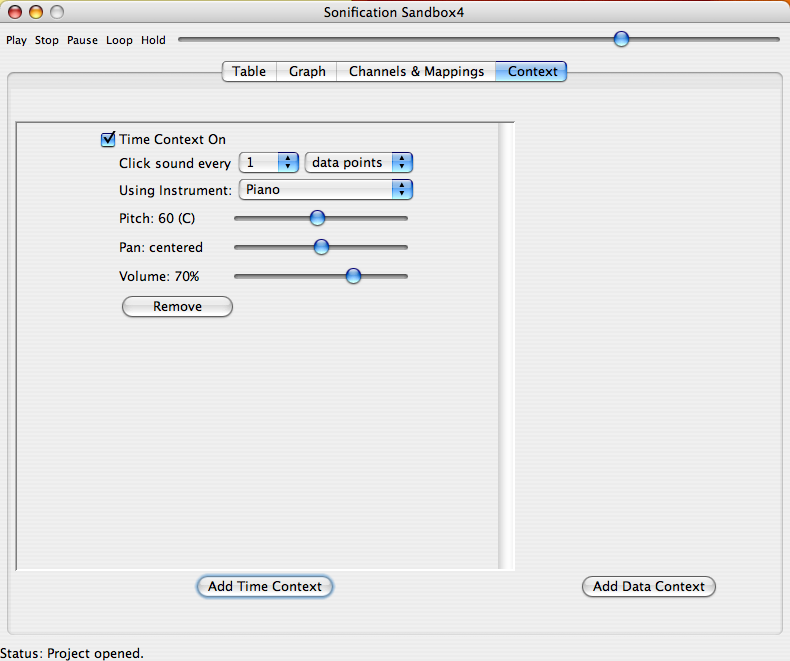 In
the Context tab, additional sounds can be added, analogous to the x-axis,
y-axis, tick marks, trend lines, etc., of visual graphs. The Click Track
(marking time, like an x-axis) can be turned on or off, and the instrument
can be changed. The user can add or remove other context sounds for
constant or repeating tones, and notifications, and set the parameters
of each.
In
the Context tab, additional sounds can be added, analogous to the x-axis,
y-axis, tick marks, trend lines, etc., of visual graphs. The Click Track
(marking time, like an x-axis) can be turned on or off, and the instrument
can be changed. The user can add or remove other context sounds for
constant or repeating tones, and notifications, and set the parameters
of each.