School of Psychology - Georgia Institute of Technology
(as of December, 2021)
 The Highcharts Sonification Studio is a collaboration between the Sonification Lab at Georgia
Tech, and Highcharts, the developers of popular and powerful online charting and graphing tools.
The Highcharts Sonification Studio is a collaboration between the Sonification Lab at Georgia
Tech, and Highcharts, the developers of popular and powerful online charting and graphing tools.
The Highcharts Sonification Studio is a project to implement many of the features of the aging (and no longer actively supported) Sonification Sandbox software, which was originally built by GT in Java about 20 years ago. That code is still functional, but is no longer supported. Instead, the new Sonification Studio supports many of the Sandbox's features in a modern online platform. It is extensible, and will be open source. We encourage the research and developers communities to leverage the new Sonification Studio platform and extend it to the needs of their projects.
Data can be entered directly into the Highcharts Sonification Studio's data editor, or imported from CSV files (which can be created in MS Excel, for example), and manipulated/edited in a spreadsheet. The Sonification Studio also supports connecting directly to a Google Sheet. The mapping between the data and the visual and auditory graphs can be changed in many ways. Visual and auditory renderings of the data are available, and the visual and auditory graphs can be exported as images, data files, audio files, and even multimodal movie files, in a range of file formats. The data plus rendering settings from a project can be saved in a special file format (.hssp) which can be saved locally, or shared with others via email, download, etc.
Sample Screenshots (may vary with new releases):
(note: click on the thumbnails to view a larger screen shot in a new window)
|
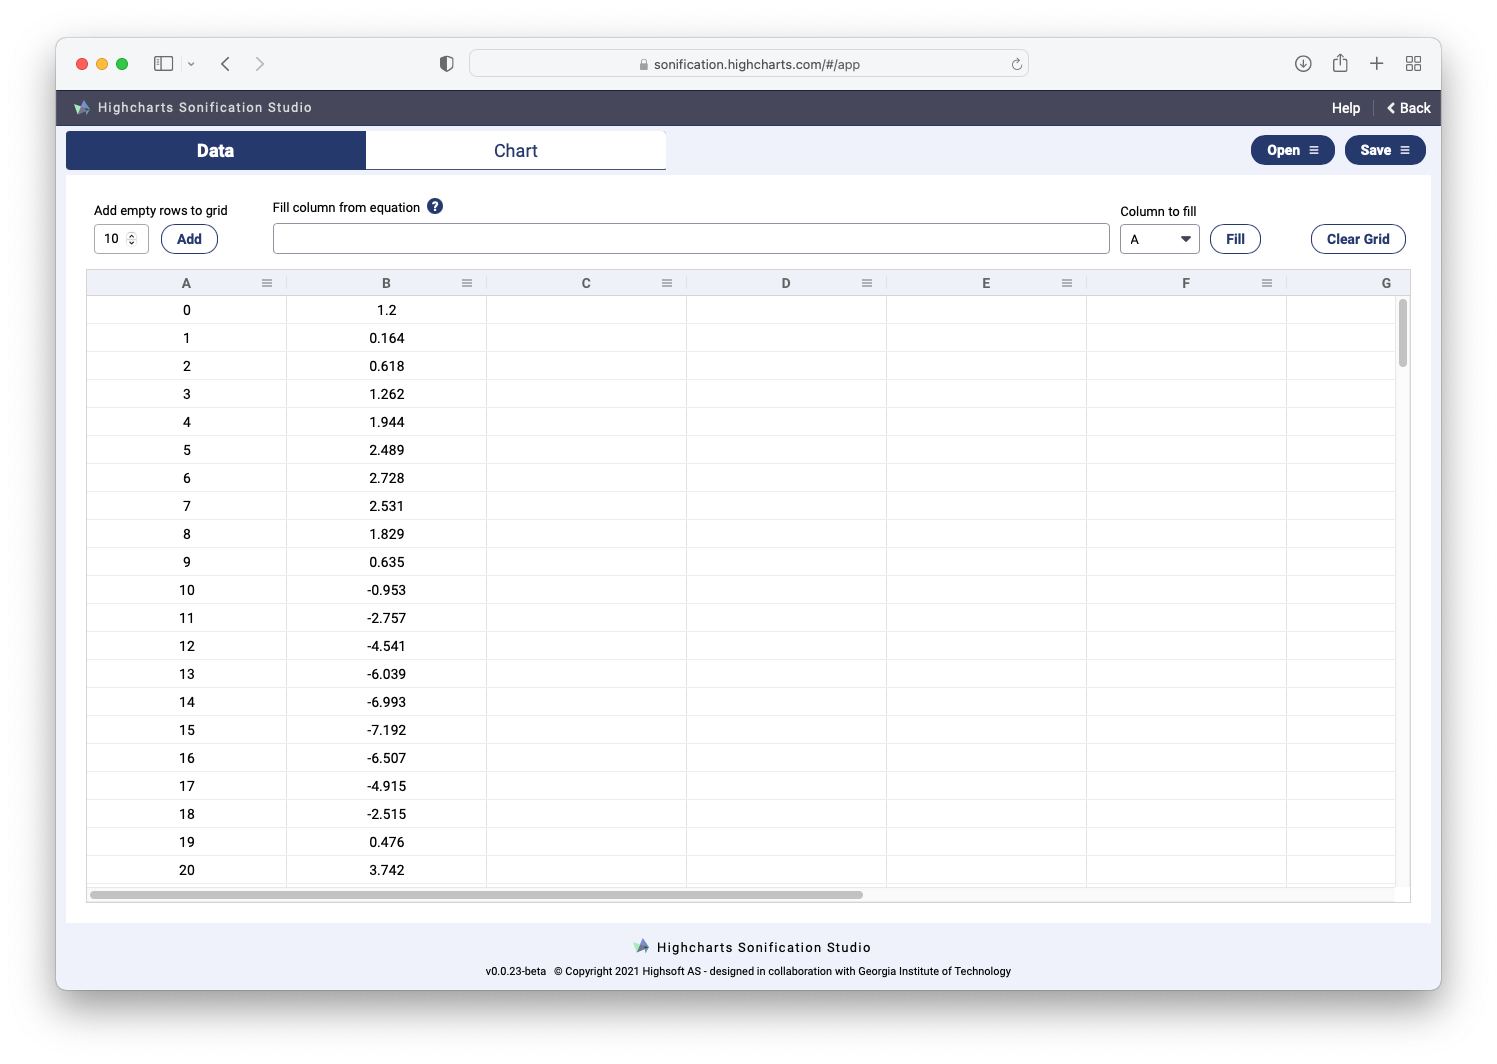
The Sonification Studio when it is first opened. Before the application can create a sonification, data must be imported or added to a table the user creates within the Data grid. Default dta are provided and can be easily cleared. When the user imports data it will automatically be loaded into the table. Data can also be created and manipulated in a Google Sheet, and that Sheet can be connected to the Sonification Studio. |
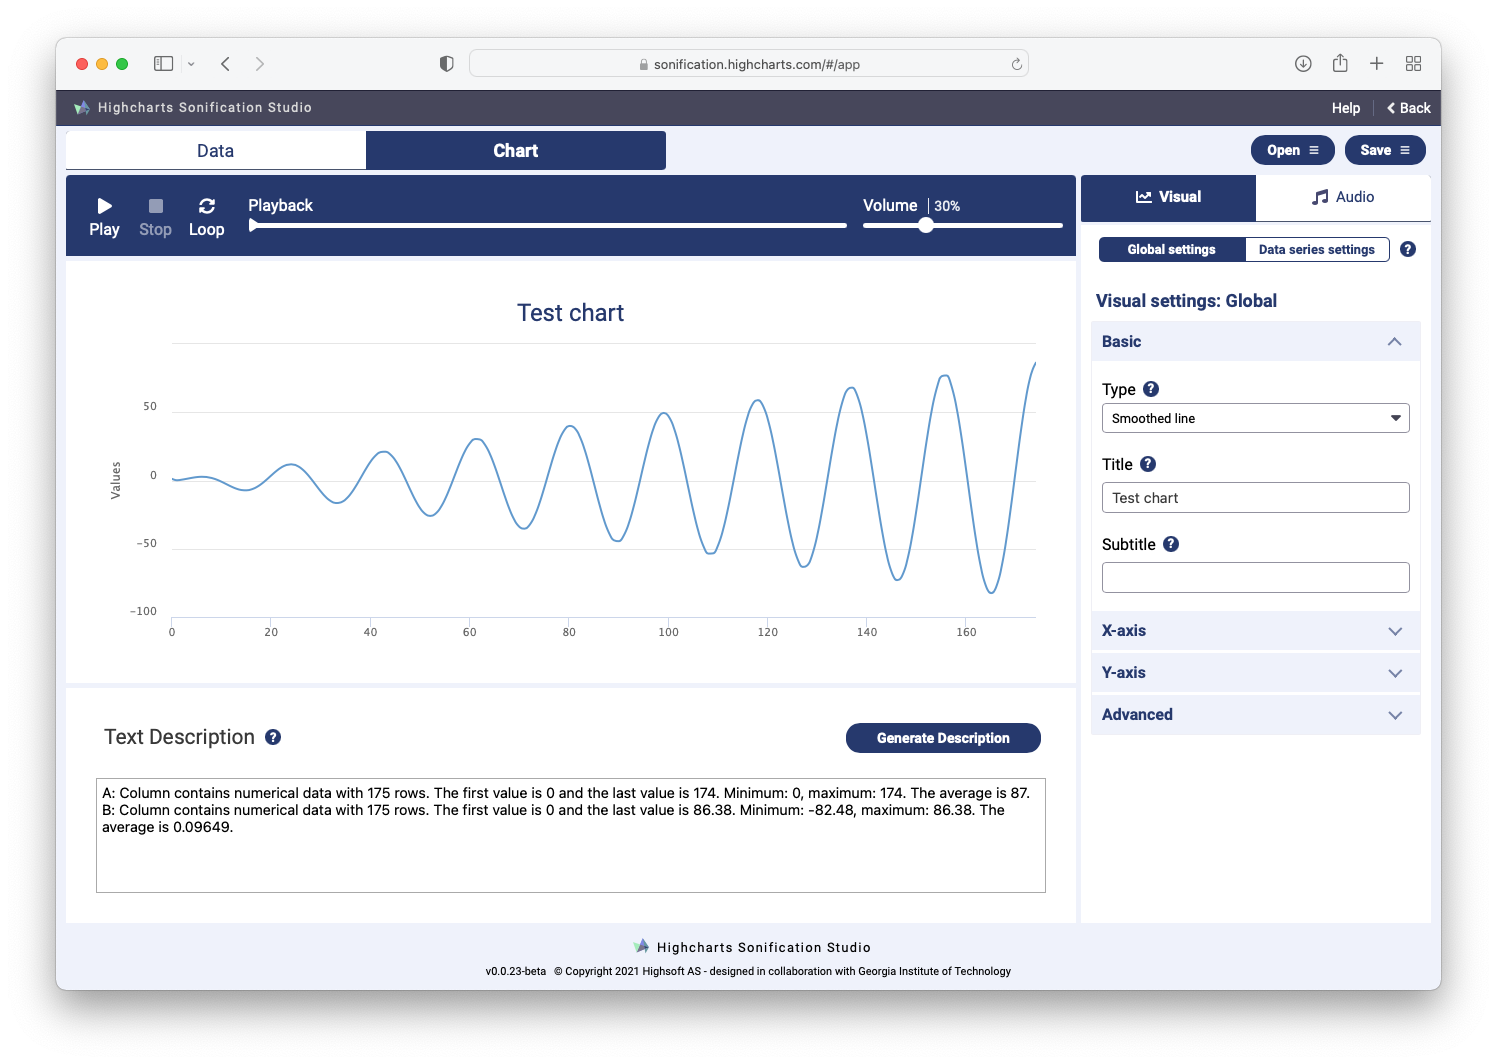
| Once data are visible in the table, the Chart tab is loaded with the default visual and audio mappings. |
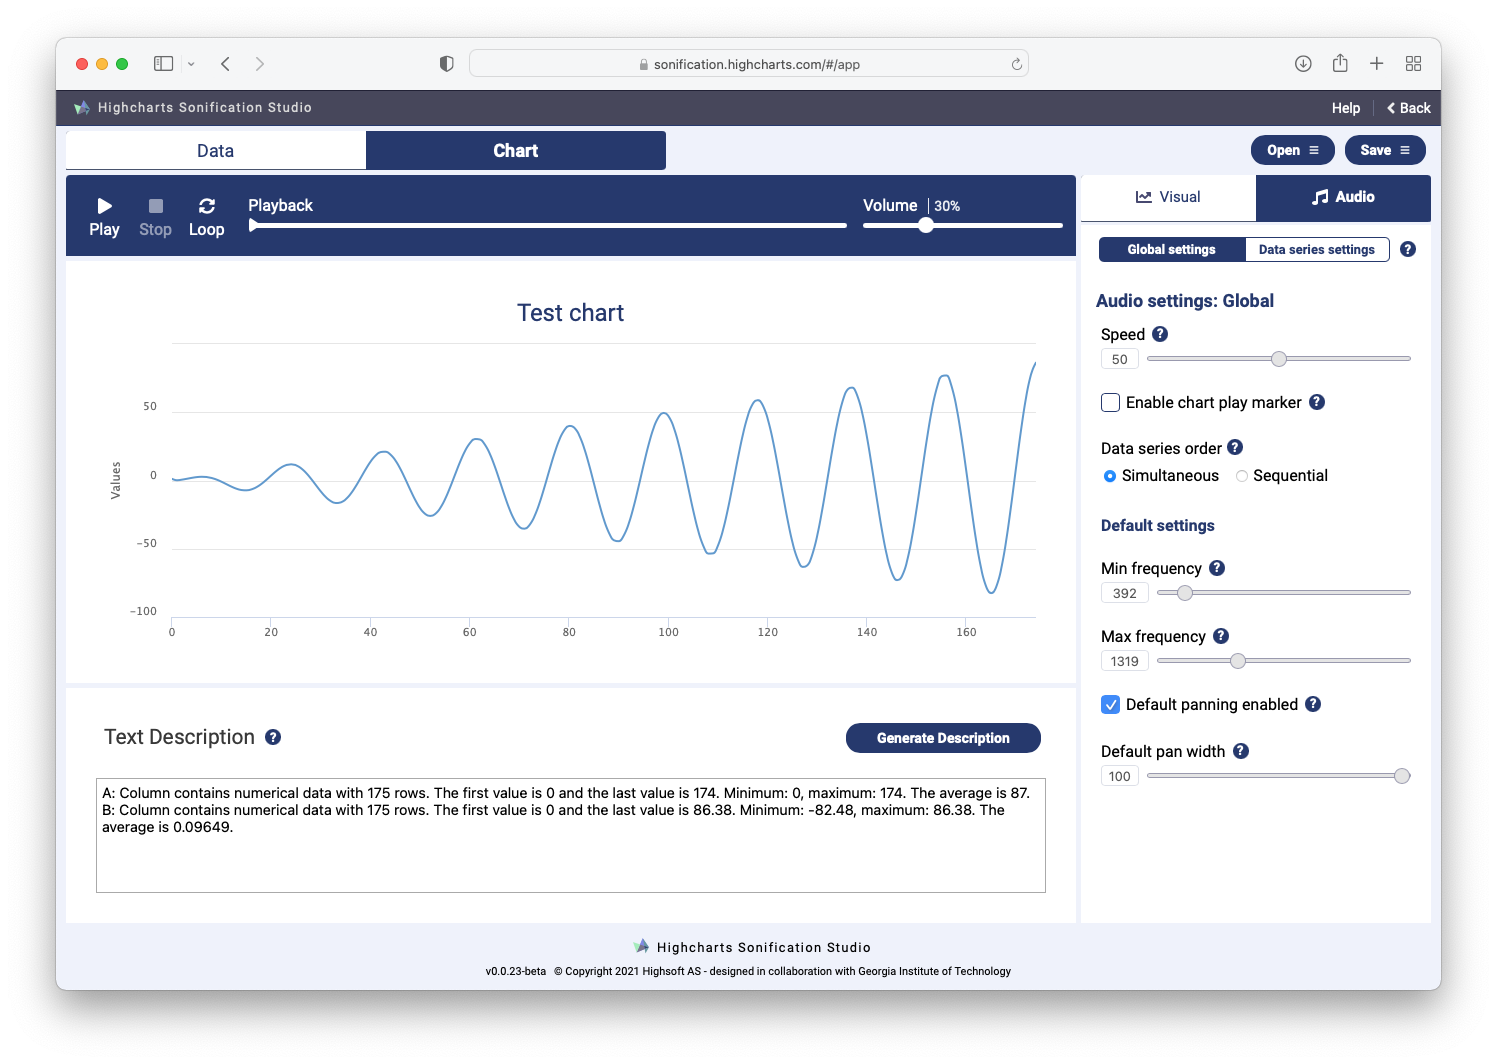
| A sonification can be played using the default mappings, however, the most interesting results are achieved by adjusting the mappings for each data set. |

| The project can be saved as a complete file, or the elements can be saved/exported as individual images, audio, and movie files. |
We have launched a YouTube Channel called Highcharts Sonification Studio How-To Videos, or @HSS_how_to.
Here is an overview video from the YouTube channel:
Visit the main Highcharts Sonification Studio website for more details and to link to the latest online version:
Highcharts Sonification Studio
Contact: