School of Psychology - Georgia Institute of Technology - Auditory Graphs
Below is an explaination of GNIE tool for reading and writing on graphs and number lines, without looking. GNIE is currently in development and is not available for download. If you would like to try it out soon, please participate in our research. You may also contact us for a live demonstration or more information.
We are working with teachers and students to better understand how this tool can be used in classrooms. We are targeting graphing questions based on Common Core Standards.
The math Graph and Number line Input and Exploration (GNIE) technology is designed to allow sighted, low vision, and blind students plot points on a number line or graph. It is a Java program that will run on current Windows and Macintosh systems.
There are three parts to the user interface: menu actions, a text area for reading and writing questions, and a graph area. Users can navigate the user interface with a mouse or a keyboard. The text area and the menu operate with regular screen readers and magnifiers, so computer-literate students who are familiar with assistive technology can quickly use these parts.
People can navigate around the graph with a mouse or a keyboard. You can both see and hear the graph. The visuals are like paper graphs. The audio is a feature on some other graphing technologies, but it features some new ideas that make it easier for visually impaired students and adults to find and add points.
This tutorial will begin with navigation on a horizontal number line, or "x-axis context". When moving around, a higher pitch means further from the left side of the number line. A slow note beat rate means off a tick mark, and a fast beat rate means on a tick mark. Labeled tick marks are spoken through an embedded text-to-speech engine. Watch the video for an example.
Points are represented with a second sound. In distance mode, there is a higher pitch when you are closer to a point. You will hear both the point sound and the x-axis context sound. Note that when using headphones, it is easier to tell the sounds apart. Watch the video for an example.
Many graphs are two-dimensional. GNIE provides a "y-axis context" for the second dimension. As people move up and down, the context sound changes, raising in pitch as the mouse moves up on the graph. Like the x-axis context, the beat rate of the sounds increase when on a tick mark, and a voice says the label. The "x" and "y" keys limit the sounds to one axis and the points, to simplify what people hear. Students can use this interface to plot points without looking at the screen. Note that when using headphones, it is easier to tell the sounds apart. Watch the video for an example.
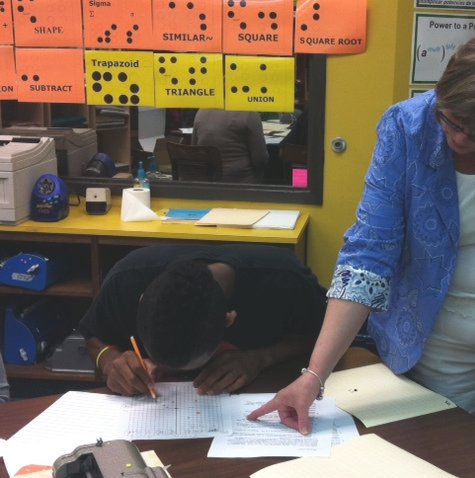
We are evaluating GNIE in mathematics classrooms. Initially, we learn about current tools used.
 |
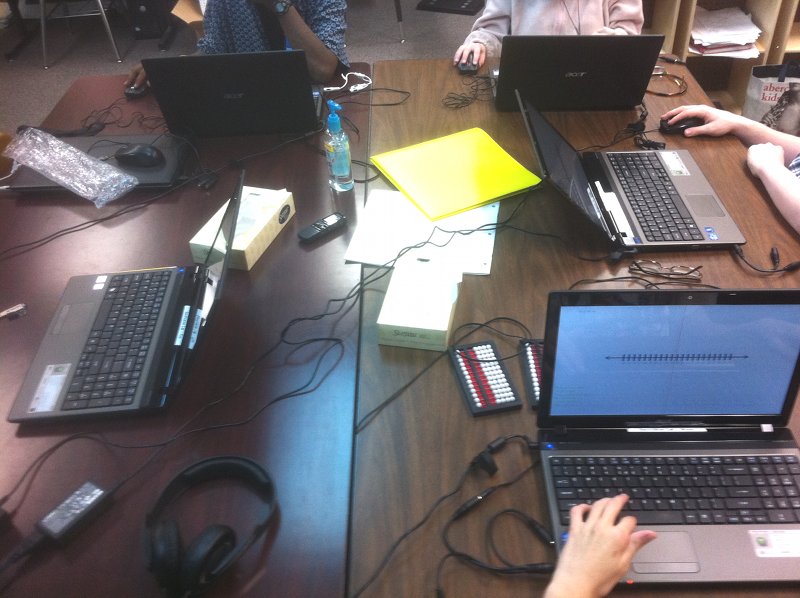
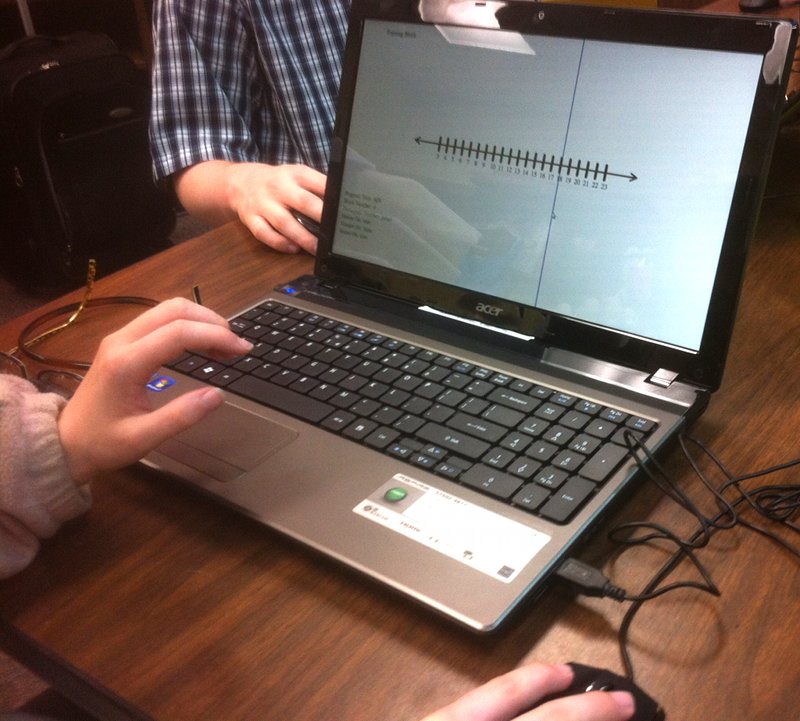
Then, we conduct training for the auditory display.
 |
 |
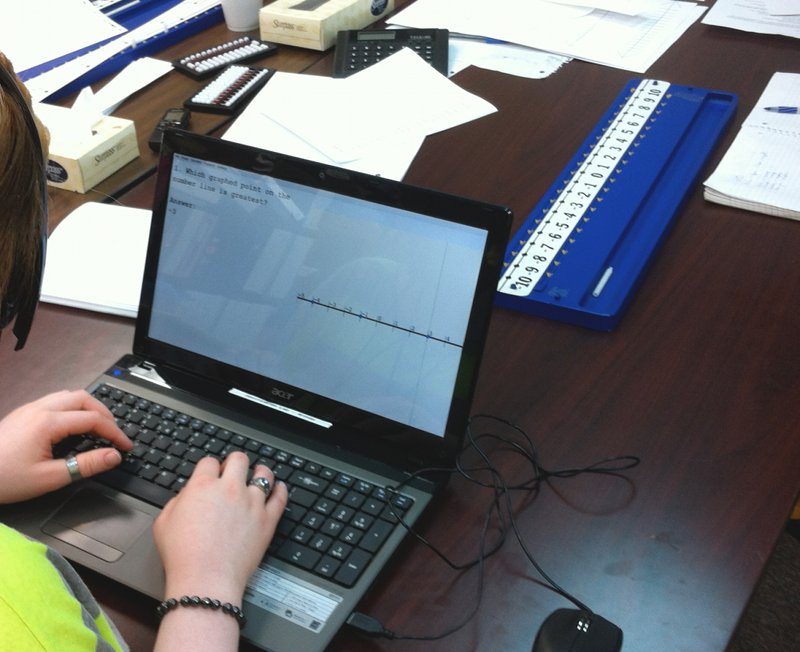
Low vision and sighted students can use GNIE to answer questions. Note that GNIE allows students to make mistakes, such as this student who has mixed up the positive/negative sign (a common mathematics mistake).
 |
More examples can be found in the results section of the SQUARE page.
It is possible to create your own graphs. Simply select "file -> new", and follow the instructions. The graphs are automatically saved in a folder called "graphs". You can send these files to anyone else with GNIE.